Have a set up data science development ecosystem, specific to Python
What is Data Science?
The Harvard Business review called the industry the ‘sexiest job of the 21st century’.
Glassdoor determined the profession to be among the most desirable in 2016 and 2017.
Sounds cool, right? But… what is it?
Data Science Examples
Netflix recommendation engine.
Apple FaceID determining if a photo contains your face.
A bank approving a credit card.
Common thread:
All leverage data to make decisions.
Class Question: What is an example of data science you have heard of? What about your stated example makes it be, well, data science?
Data Science Definition
Compliments of GA’s Standard Board:
Data science is the practice of: acquiring, organizing, and delivering complex data; discovering relationships and anomalies among variables; building and deploying machine learning models; and synthesizing data to influence decision-making.
tl;dr: Data scientists:
Use data of all kinds (numbers, text, images).
Make explanations and predictive decisions.
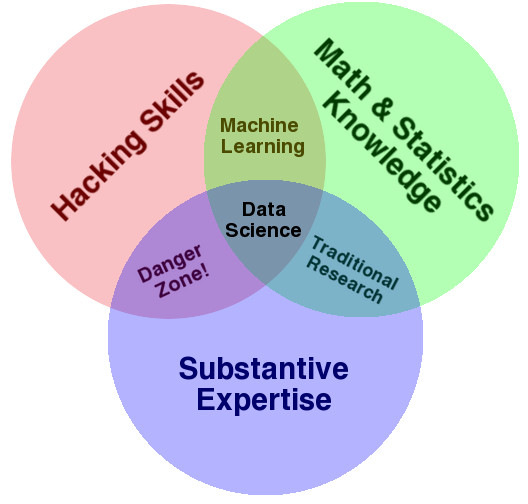
Conway Venn Diagram
Specific Data Scientist Roles
What does that break down to?
Machine Learning Engineer
Data Engineer
Research Science
Advanced Analyst
Machine Learning Engineer
Identify machine learning applications.
Work in production code.
Manage infrastructure and data pipelines
“Straddle the line between knowing the mathematics and coding the mathematics.”
eBay VP of engineering Japjit Tulsi
Data Engineer
Create the architecture that allows data acquisition and machine learning problems to run at scale.
Focus on the algorithm and the analysis.
Don’t work much on the software side.
Research Scientist
PhD-heavy field.
Determines new algorithmic optimizations.
Focused on driving scientific discovery.
Less concerned with pursuing industrial applications.
Applied research scientists:
Specialized research scientist.
Backgrounds in both data science and computer science.
Invaluable members of any AI team.
“They can both pitch in on data science and write code. Finding a good applied research scientist is worth her weight in gold.
Japjit Tulsi
Advanced Analysts
Quantitative-minded.
Apply data descriptive and inferential exploratory data analysis and modeling.
Quick Review
Data science is the practice of:
Acquiring, organizing, and delivering complex data; discovering relationships and anomalies among variables.
Building and deploying machine learning models.
Synthesizing data to influence decision-making.
Specific Data Science Roles Include:
Machine Learning Engineer
Data Engineer
Research Science
Advanced Analyst
How Do We…
Go through data science workflow?
Solve a data science problem?
Craft a data science problem statement?
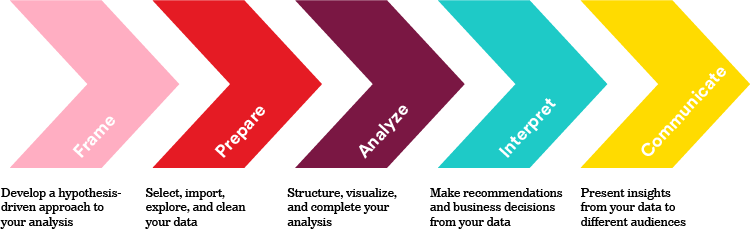
The Data Science Workflow
Class Discussion: Which step do you believe will be most challenging?
There’s no objectively correct answer!
Notes on the Steps
Not hard-set rules.
Really, problem-solving guidelines.
Every problem’s different!
Some projects may not require every step.
It’s normal to repeat certain steps a few times.
The process is cyclical with new findings!
Step 1 is Always “Frame the Problem”
Solving data science task starts with a clearly defined problem.
Poor results stem from no defined goal.
“A problem well stated is half solved.” — Charles Kettering
From there, you can apply your steps.
The Data Science Workflow: Applied
You need to reduce the costs of staffing.
You have a table of DSW current retail sales associates across department stores.
The first three rows look like this:
Job Level
Current Employee
Reason for Termination
Years of Service
Candidate Source
Previous Employer
School
Time to Fill (Days)
Associate
N
New offer
1.5
Referral
Jake’s Hawaiian Shirts
University of Minnesota
40
Associate
Y
N/A
2.0
Internship
N/A
University of Iowa
15
Associate
No
Tardiness
0.5
Online
Hats and Caps
University of Nebraska
25
Step One: Frame
We know:
We want to reduce costs associated with staffing.
We don’t know:
What drives up costs of staffing?
Is there an underlying reason for those costs?
What hypothesis can we test to reduce costs?
Class Discussion: What factors affect HR costs? How could we minimize these?
Step Two: Prepare
Class Question: What questions do you have about the dataset?
Job Level
Current Employee
Reason for Termination
Years of Service
Candidate Source
Previous Employer
School
Time to Fill (Days)
Associate
N
New offer
1.5
Referral
Jake’s Hawaiian Shirts
University of Minnesota
40
Associate
Y
N/A
2.0
Internship
N/A
University of Iowa
15
Associate
No
Tardiness
0.5
Online
Hats and Caps
University of Nebraska
25
Step Three: Analyze
We want to:
Create meaning and conduct statistical description and inference.
For example, the average Years of Service is ~1.33 years.
Could we build a machine learning model to predict this?
The data could center on their background (school, previous employers, and application source).
For example, is the relationship between Time to Fill and Years of Service positive or negative?
Positive: when one increases, the other increases.
Negative: when one increases, the other decreases.
Step Four: Interpret
How do our results compare to our initial hypothesis?
What concrete actions do we recommend?
Class Question: Even with an extremely limited dataset (n=3), can you identify hypothesis-validating or invalidating anecdotes?
At this stage, treat metrics and results like “check engine lights.”
Result summaries may point you in the right direction, but they do not necessarily explain the full context at hand.
Step Five: Communicate
Results are only as convincing as they are conveyed to key stakeholders!
Back up your statement with evidence, including statistical tests, visualizations, and model results.
Quick Review
The data science workflow:
Why Python for Data Science
Easy to write
Data science is inherently a cross-functional discipline!
A language for all audiences is key.
Open source
New techniques become available daily!
Developers from around the world race to implement new libraries.
This places Python in contrast to closed source, paid data analysis tools like SAS and SPSS.
Often used for data analysis, scripting, and rapid software development.
Getting Data Science Tools
We can analyze data to determine what Python is most used for:
Pandas?
A Python package for exploratory analysis.
Let’s use it!
You Do: Your Data Science Development Tools
Python packages in DS are ubiquitous: - Reading CSVs, linear algebra, linear regressions, matrices…
Anaconda (“Conda”): - Package manager. - Downloads everything for us!
Follow these steps:
Download Anaconda: https://www.anaconda.com/download/. Select Python 3.6+ for your machine (macOS or PC)
Open the file. Follow the on-screen prompts. Don’t hesitate to ask questions!
Please wait once you have successfully installed Anaconda.
What Are We Downloading?
Pandas:
The default tool for data exploration and manipulation in Python.
Jupyter Notebooks and Jupyter Lab:
The preferred integrated development environments (IDEs) of data science.