---
## Learning Objectives
*After this lesson, you will be able to:*
- Apply the data science workflow.
- Have a set up data science development ecosystem, specific to Python
---
## What is Data Science?
- The Harvard Business review called the industry the 'sexiest job of the 21st century'.
- Glassdoor determined the profession to be among the most desirable in 2016 and 2017.
Sounds cool, right? But... what is it?
---
## Data Science Examples
- Netflix recommendation engine.
- Apple FaceID determining if a photo contains your face.
- A bank approving a credit card.
Common thread:
- All leverage data to make decisions.
**Class Question:** What is an example of data science you have heard of? What about your stated example makes it be, well, data science?
---
## Data Science Definition
Compliments of GA's Standard Board:
> Data science is the practice of: acquiring, organizing, and delivering complex data; discovering relationships and anomalies among variables; building and deploying machine learning models; and synthesizing data to influence decision-making.
**tl;dr:** Data scientists:
- Use data of all kinds (numbers, text, images).
- Make explanations and predictive decisions.
---
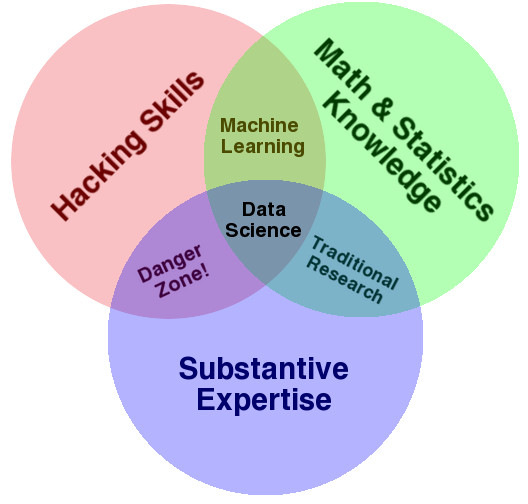
## Conway Venn Diagram
---
## Specific Data Scientist Roles
What does that break down to?
- Machine Learning Engineer
- Data Engineer
- Research Science
- Advanced Analyst
---
## Machine Learning Engineer
- Identify machine learning applications.
- Work in production code.
- Manage infrastructure and data pipelines
- “Straddle the line between knowing the mathematics and coding the mathematics.”
- eBay VP of engineering Japjit Tulsi
---
## Data Engineer
- Create the architecture that allows data acquisition and machine learning problems to run at scale.
- Focus on the algorithm and the analysis.
- Don't work much on the software side.
---
## Research Scientist
- PhD-heavy field.
- Determines new algorithmic optimizations.
- Focused on driving scientific discovery.
- Less concerned with pursuing industrial applications.
**Applied research scientists**:
- Specialized research scientist.
- Backgrounds in both data science and computer science.
- Invaluable members of any AI team.
- “They can both pitch in on data science and write code. Finding a good applied research scientist is worth her weight in gold.
- Japjit Tulsi
---
## Advanced Analysts
- Quantitative-minded.
- Apply data descriptive and inferential exploratory data analysis and modeling.
---
## Quick Review
Data science is the practice of:
- Acquiring, organizing, and delivering complex data; discovering relationships and anomalies among variables.
- Building and deploying machine learning models.
- Synthesizing data to influence decision-making.
Specific Data Science Roles Include:
- Machine Learning Engineer
- Data Engineer
- Research Science
- Advanced Analyst
---
## How Do We...
- Go through data science workflow?
- Solve a data science problem?
- Craft a data science problem statement?
---
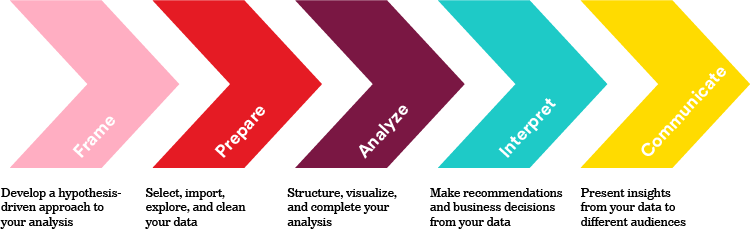
## The Data Science Workflow
**Class Discussion:** Which step do you believe will be most challenging?
- There's no objectively correct answer!
---
## Notes on the Steps
- Not hard-set rules.
- Really, problem-solving guidelines.
Every problem's different!
- Some projects may not require every step.
- It's normal to repeat certain steps a few times.
- The process is cyclical with new findings!
---
## Step 1 is Always "Frame the Problem"
Solving data science task starts with a clearly defined problem.
- Poor results stem from no defined goal.
_“A problem well stated is half solved.”_ — Charles Kettering
From there, you can apply your steps.
---
## The Data Science Workflow: Applied
You need to reduce the costs of staffing.
You have a table of DSW current retail sales associates across department stores.
The first three rows look like this:
| Job Level | Current Employee | Reason for Termination | Years of Service | Candidate Source | Previous Employer | School | Time to Fill (Days) |
|---|---|---|---|---|---|:---:|---:|
| Associate | N | New offer | 1.5 | Referral | Jake's Hawaiian Shirts | University of Minnesota | 40 |
| Associate | Y | N/A | 2.0 | Internship | N/A | University of Iowa | 15 |
| Associate | No | Tardiness | 0.5 | Online | Hats and Caps | University of Nebraska | 25 |
---
## Step One: Frame
We know:
- We want to reduce costs associated with staffing.
We don't know:
- What drives up costs of staffing?
- Is there an underlying reason for those costs?
- What hypothesis can we test to reduce costs?
**Class Discussion:** What factors affect HR costs? How could we minimize these?
---
## Step Two: Prepare
**Class Question:** What questions do you have about the dataset?
| Job Level | Current Employee | Reason for Termination | Years of Service | Candidate Source | Previous Employer | School | Time to Fill (Days) |
|---|---|---|---|---|---|:---:|---:|
| Associate | N | New offer | 1.5 | Referral | Jake's Hawaiian Shirts | University of Minnesota | 40 |
| Associate | Y | N/A | 2.0 | Internship | N/A | University of Iowa | 15 |
| Associate | No | Tardiness | 0.5 | Online | Hats and Caps | University of Nebraska | 25 |
---
## Step Three: Analyze
We want to:
- Create meaning and conduct statistical description and inference.
For example, the average Years of Service is ~1.33 years.
- Could we build a machine learning model to predict this?
- The data could center on their background (school, previous employers, and application source).
For example, is the relationship between Time to Fill and Years of Service positive or negative?
- Positive: when one increases, the other increases.
- Negative: when one increases, the other decreases.
---
## Step Four: Interpret
How do our results compare to our initial hypothesis?
What concrete actions do we recommend?
**Class Question:** Even with an extremely limited dataset (`n=3`), can you identify hypothesis-validating or invalidating anecdotes?
At this stage, treat metrics and results like "check engine lights."
- Result summaries may point you in the right direction, but they do not necessarily explain the full context at hand.
---
## Step Five: Communicate
Results are only as convincing as they are conveyed to key stakeholders!
Back up your statement with evidence, including statistical tests, visualizations, and model results.
---
## Quick Review
The data science workflow:

---
## Why Python for Data Science
Easy to write
- Data science is inherently a cross-functional discipline!
- A language for all audiences is key.
Open source
- New techniques become available daily!
- Developers from around the world race to implement new libraries.
- This places Python in contrast to closed source, paid data analysis tools like SAS and SPSS.
Often used for data analysis, scripting, and rapid software development.
---
## Getting Data Science Tools
- We can analyze data to determine what Python is most used for:

- Pandas?
- A Python package for exploratory analysis.
- Let's use it!
---
## You Do: Your Data Science Development Tools
Python packages in DS are ubiquitous:
- Reading CSVs, linear algebra, linear regressions, matrices...
**Anaconda** ("Conda"):
- Package manager.
- Downloads everything for us!
Follow these steps:
1. Download [Anaconda](https://www.anaconda.com/download/): `https://www.anaconda.com/download/`. Select Python 3.6+ for your machine (macOS or PC)
2. Open the file. Follow the on-screen prompts. Don't hesitate to ask questions!
Please wait once you have successfully installed Anaconda.
---
## What Are We Downloading?
Pandas:
- The default tool for data exploration and manipulation in Python.
Jupyter Notebooks and Jupyter Lab:
- The preferred integrated development environments (IDEs) of data science.
- We'll write our code in this!
NumPy, SciPy, and [more](https://docs.anaconda.com/anaconda/packages/py3.6_osx-64):
- Other packages for statistical inference, visualization, and parallelizing operations.
---
## You Do: Launching Jupyter Notebooks
- Use your computer's program search method (Spotlight on Mac) to search "Anaconda Navigator".
- Open Anaconda Navigator
- Click "Launch" on Jupyter Notebooks.
_wait..._
It opens in your browser!
You have a Jupyter Notebook!
---
## Why Jupyter Notebooks?
Data science is both code and methods
What if we're missing many values?
- Do you fill in missing values with the mean or the median?
- Easy to create code cells next to text cells.
Easy to connect to remote computers (datac enters).
- Thus, the Jupyter Notebook is in your browser!
---
## Quick Review
- Pandas
- A Python package for exploratory analysis.
- Jupyter Notebooks and Jupyter Lab:
- The preferred integrated development environments (IDEs) of data science.
- We'll write our code in this!
Anaconda helps us download these. You only had to download it once!
---
## We Do: Code Cells
Let's begin!
- Make a code cell: Click the **+** in the upper left corner.
- Inside the code cell, write:
```python
print('hello world')
```
- Be sure your cursor is inside the cell. Press `"control" + Enter`.
- Always how you run cells!
Voila!
---
## We Do: Markdown Cells
Write and format plain text.
- Make a code cell: Click the **+** in the upper left corner.
- You're going to be doing this a lot!
- Change this cell to a markdown cell:
- Click: `cell` > `cell Type` > `Markdown`.
- *(You can also click the dropdown menu that says "Code" and change it to "Markdown")*
- Inside the markdown cell, write:
```md
## Hello world
```
Run the cell: `"control" + Enter` Bam! Pretty formatted text.
*Note*: We will not spend time learning markdown syntax! Instead, take a look at the cheatsheet and links in Additional Resources.
---
## Closing Down
- Exit the tab in your browser.
- That doesn't quit the Notebook!
- Open your Terminal (or Anaconda Prompt on Windows).
- Hit `control + C`. This closes the running process.
---
## Summary:
Data scientists:
- Use data of all kinds (numbers, text, images).
- Make explanations and predictive decisions.
Data Science Workflow:
- Frame -> Prepare -> Analyze -> Interpret -> Communicate.
Jupyter Notebooks:
- The industry tool!
- Interactive with Python.
---
## Additional Resources
- What is data science from GA's Standards Board [blog post](https://theindex.generalassemb.ly/why-we-need-to-redefine-data-science-7f05ab0286d4)
- Stack Overflow [blog](stackoverflow.blog/2017/09/06/incredible-growth-python/) (1) [posts](https://stackoverflow.blog/2017/09/14/python-growing-quickly/) (2) on Python's growth
- Markdown cheatsheet [here](https://github.com/adam-p/markdown-here/wiki/Markdown-Cheatsheet)
- Interactive markdown cheatsheet [here](http://markdownlivepreview.com/)