---
## Learning Objectives
*After this lesson, you will be able to:*
- Use Pandas to read in a dataset.
- Investigate a dataset's integrity.
- Filter, sort, and manipulate DataFrame series.
---
## What is Pandas?
- A group of adorable bears 🐼🐼🐼
- A Python library for data manipulation.
---
## So, Pandas the Library
The Swiss Army Knife of data manipulation!
Pandas:
- Is *the* library for exploratory data analysis (EDA).
- Formats, wrangles, cleans, and prepares our data.
Quick Backstory from 2009:
- A humble open source project for Panel Data (hence "Pandas") from Wes McKinney.
- Now the most used Python-related tag on Stack Overflow.
---
## Exploratory Data Analysis (EDA)
The process of understanding our dataset and producing our first level of insights.
This includes:
- Reading in data: "Import dog population."
- Checking data types. "Is the population count in integers?"
- Renaming columns: "`dog_breed` is more helpful than `Biological Family`"
- Joining together data: "Join the dog population data with the cat population data."
- Looking for missing data: "It doesn't mention corgis."
- And more!
Today, we will focus on the most 'mission critical' elements of EDA.
---
## Quick Review
- Exploratory Data Analysis (EDA) is the process of understanding our dataset, and producing our first level of insights.What does this include?
- Pandas is a prominent Python library used for exploratory data analysis
---
## What dataset are we exploring?
- Iowa liquor sales!
- Stores report daily transactions of all alcohol they sell.
- Iowa makes this data available.
- It is an excellent, structured dataset for analysis!
Take a look at the data source [page](https://data.iowa.gov/Economy/Iowa-Liquor-Sales/m3tr-qhgy).
---
## Discussion: What Could We Examine?
- What are some potential insights you'd like to uncover given Iowa liquor data?
- What if you are examining it from the standpoint of the Iowa government?
- What if you are a potential liquor store business owner?
---
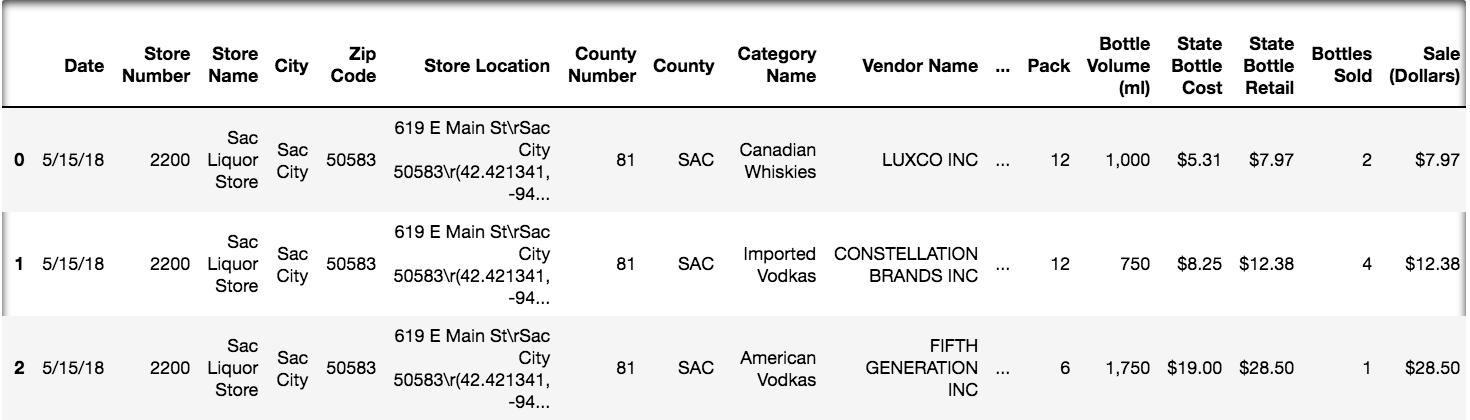
## Our Modified Iowa Liquor Dataset
The full dataset is all liquor sales from 2012 to present.
There are more than 13 million rows (13,948,103+ at the time of writing)!
We will work with a modified dataset.
Key changes:
- Only sales from May 2017 and May 2018
- Intentionally deleted:
- A number of values, to practice missing data.
- An arbitrary subset of entire observations, to shrink it.
- A few columns, to simplify.
---
## The First Few Rows
---
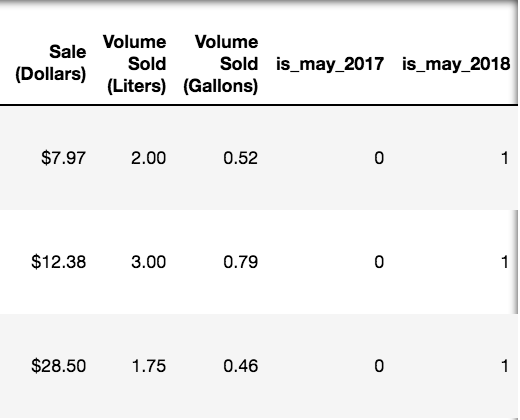
## The First Few Rows (Ctd)
---
## Data Integrity
The first thing we check! Assuring our data can be trusted to produce meaningful insights.
Correctly formatted datatypes.
- "Decimals are floats, not strings."
Representative sample for the underlying population of interest.
- "Did we sample sales in cities or across the whole state?"
Missing Data
- "Why do we only have even days of the month?"
No sampling or human bias.
- "Did we only consider liquor sales of specific varieties?"
---
## Clean Truth about Dirty Data
- Assessing data integrity isn't a one-stop step.
- Much like EDA itself, it's an ongoing process!
- We uncover additional potential problems and anomalies to remedy along the way.
---
## Launch our notebook
We'll work in the Notebook
- We're fledgling data scientists!
The `.ipynb` file you will open is called " `pandas-i.ipynb` ".
Open it up!
Jump down to `Importing Pandas`.
---
## Additional Resources
- Pandas [documentation](https://pandas.pydata.org/pandas-docs/stable/)
- DataSchool [30-video series](http://www.dataschool.io/easier-data-analysis-with-pandas/) (by a former GA instructor!)