You can not select more than 25 topics
Topics must start with a letter or number, can include dashes ('-') and can be up to 35 characters long.
403 lines
10 KiB
403 lines
10 KiB
<!--
|
|
---
|
|
title: Next Steps in Data Science
|
|
type: lesson
|
|
duration: "0:45"
|
|
creator: Joseph Nelson
|
|
---
|
|
-->
|
|
|
|
<h1>Next Steps in Data Science</h1>
|
|
|
|
<!--
|
|
|
|
## Overview
|
|
This lesson recaps what students have achieved, contextualizes that into the broader data science ecosystem, and recommends libraries and resources to further their journey.
|
|
|
|
## Learning Objectives
|
|
*After this lesson, you will be able to:*
|
|
|
|
- Identify core libraries in the data science ecosystem, and their purpose
|
|
- Determine how to learn more about which area is most interesting to you!
|
|
- Discuss hiring in the data science job market, and strategies to support a search
|
|
|
|
## Duration
|
|
45 minutes.
|
|
|
|
|
|
## Suggested Agenda
|
|
|
|
| Time | Activity | Purpose |
|
|
|-------------|----------|---------|
|
|
| 0:00 - 0:03 | Welcome |
|
|
| 0:03 - 0:18 | Introspection and Review |
|
|
| 0:18 - 0:43 | Establishing Yourself |
|
|
| 0:43 - 0:45 | Summary |
|
|
|
|
## Materials and Preparation:
|
|
- Give out the link to the slides.
|
|
- This lesson, more than any other in this unit, gives the instructor the ability to inject their own perspective throughout the lesson. Do not hesitate to do so!
|
|
|
|
## Differentiation and Extensions
|
|
|
|
- Add your own experience throughout the lesson.
|
|
- If you're teaching this on campus to students, feel free to add several interview prep questions towards the end.
|
|
|
|
-->
|
|
|
|
---
|
|
|
|
## Learning Objectives
|
|
*After this lesson, you will be able to:*
|
|
|
|
- Identify core libraries in the data science ecosystem.
|
|
- Determine how to learn more about which area is most interesting to you!
|
|
- Discuss hiring in the data science job market and strategies to support a search.
|
|
|
|
---
|
|
|
|
## Celebrate
|
|
|
|
Reflect for a moment - you've:
|
|
|
|
- Learned the fundamentals of Python, from data types to object oriented programming.
|
|
- Used your first API to build a simple application.
|
|
- Applied Pandas to synthesize insights from datasets.
|
|
|
|
That's a lot! It deserves a huge congratulations.
|
|
|
|
---
|
|
|
|
## Discussion: Introspection
|
|
|
|
- What did you enjoy most?
|
|
|
|
- What did you find most intriguing?
|
|
|
|
- What do you want to know more about?
|
|
|
|
- What caused the most struggle?
|
|
|
|
This isn't an all-frills exercise. It helps inform your future data science growth!
|
|
|
|
---
|
|
|
|
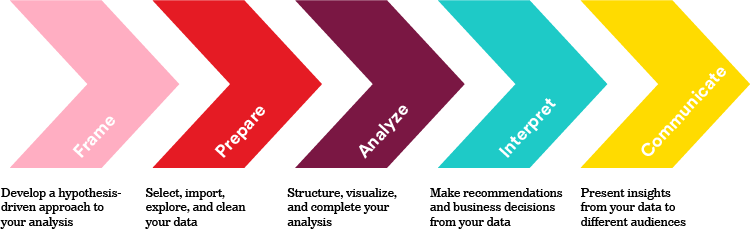
## Revisiting the data science process
|
|
|
|
It's important to place our Pandas work into the broader picture of data science.
|
|
|
|
To do so, recall our data science workflow:
|
|
|
|
|
|
|
|
---
|
|
|
|
## Discussion: Condensed Workflow
|
|
|
|
1. **Identify** the problem
|
|
2. **Acquire** the right data
|
|
3. **Parse** the data
|
|
4. **Mine** our data
|
|
5. **Refine** our data
|
|
6. **Build** a model
|
|
7. **Present** our work
|
|
|
|
**Class Question**: Where have we focused our work?
|
|
|
|
---
|
|
|
|
## Where we focused
|
|
|
|
|
|
1. Identify the problem
|
|
2. Acquire the right data
|
|
3. **Parse the data. We did this!** Remember the Adventure Works Production.Product dictionary? Did you revisit IMDB's source to understand any columns?
|
|
4. **Mine our data. We did this!** Checked subpopulation analyses and, perhaps, feature creation. We filtered to a specific county; potentially creating our own IMDB v Rotten Tomato metrics.
|
|
5. **Refine our data. We did this!** We mutated our data using the .apply() method to modify prices and color of products.
|
|
6. Build a model
|
|
7. Present our work
|
|
|
|
---
|
|
|
|
## Where we did a bit
|
|
|
|
1. **Identify the problem. We did a bit!** Identify your own question about IMDB data, and answer it.
|
|
2. **Acquire the right data. We did a bit!** Using the OMDBApi to obtain Rotten Tomato data for our IMDB dataset.
|
|
3. Parse the data
|
|
4. Mine our data
|
|
5. Refine our data
|
|
6. Build a model
|
|
7. **Present our work. We did a bit!** Maintaining clean Jupyter Notebooks (right?) and creating takeaway visualizations.
|
|
|
|
***Whew***! We did cover a lot of ground!
|
|
|
|
---
|
|
|
|
## Where we didn't Focus
|
|
|
|
1. Identify the problem
|
|
2. Acquire the right data
|
|
3. Parse the data
|
|
4. Mine our data
|
|
5. Refine our data
|
|
6. **Build a model. We never did this!**
|
|
7. Present our work
|
|
|
|
> "Hey! I thought that's all data science is! Machine learning artificial intelligence neural networks [on the blockchain]!"
|
|
|
|
---
|
|
|
|
## The truth about data science
|
|
|
|
|
|
- Exploratory data analysis is typically **80%** of a data science problem.
|
|
- Modeling is **20%**.
|
|
|
|
What's more:
|
|
|
|
- The steps you take to set up your models in EDA, ultimately have a outsized impact on the result you will achieve.
|
|
|
|
---
|
|
|
|
|
|
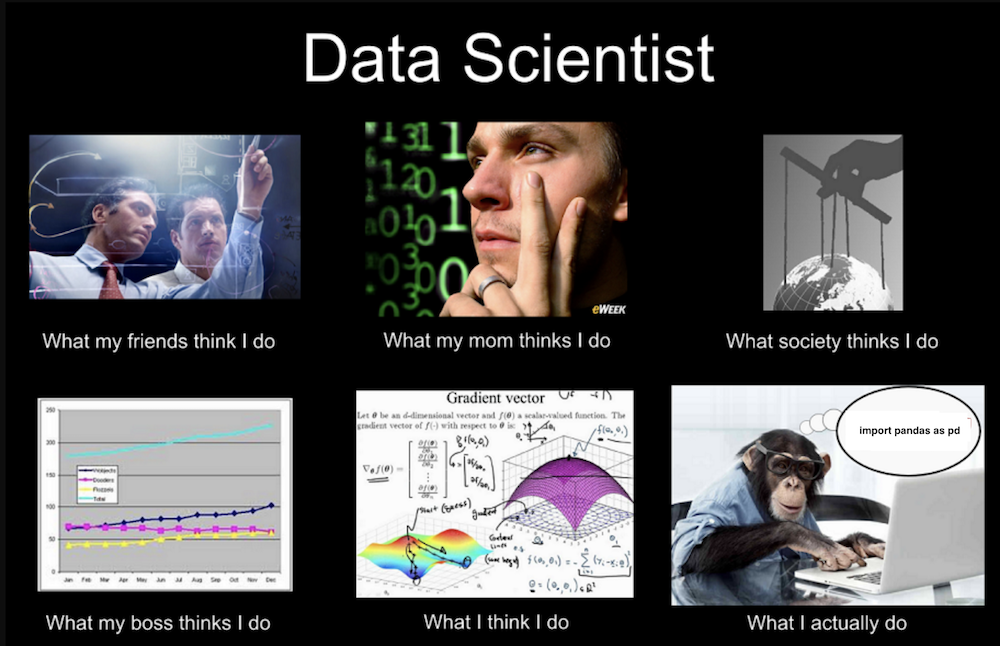
## Apologies in advance for this one
|
|
|
|
|
|
|
|
---
|
|
|
|
|
|
## Exceptions
|
|
|
|
|
|
- Many companies will structure teams such that some individuals focus 100% of their time on the 20% of the problem which is solved by modeling.
|
|
|
|
- We've focused on Pandas EDA.
|
|
- The area you can make the greatest impact with.
|
|
|
|
---
|
|
|
|
## Python Data Science Package Ecosystem
|
|
|
|
|
|
We know Pandas!
|
|
|
|
- Awesome!
|
|
- Reads in data.
|
|
- Exploratory data analysis.
|
|
- Munging.
|
|
- Wrangling.
|
|
- Visualization via matplotlib
|
|
|
|
|
|
What else is there?
|
|
|
|
|
|
---
|
|
|
|
## Recommend Libraries for DS
|
|
|
|
Once you're comfortable with Pandas...
|
|
|
|
- **Seaborn:**
|
|
- Creates visualizations (of greater complexity than Pandas)
|
|
- With a few lines of code via `matplotlib`
|
|
- **NumPy:**
|
|
- Numerical computation, particularly linear algebra.
|
|
- **SciPy:**
|
|
- Scientific computation, especially statistics.
|
|
- **Requests:**
|
|
- Making web requests - calling APIs!
|
|
- **Plotly:**
|
|
- Interactive plots!
|
|
|
|
---
|
|
|
|
## Other DS Libraries
|
|
|
|
Not as ubiquitous or popular, but still good:
|
|
|
|
- **BeautifulSoup:**
|
|
- Easily parse HTML.
|
|
- **Statsmodels:**
|
|
- Traditional statistic inference techniques, like linear regression.
|
|
- **Scikit-learn:**
|
|
- All-purpose machine learning model construction.
|
|
- **NLTK** | **SpaCy**
|
|
- Natural language processing.
|
|
- **TensorFlow** | **PyTorch** | **MxNet**
|
|
- Neural network research and model construction.
|
|
- **PySpark**
|
|
- Interacting with big data.
|
|
|
|
---
|
|
|
|
## Discussion: What-for-what?
|
|
|
|
At what step would each library be most helpful?
|
|
|
|
The data science steps:
|
|
|
|
- **Identify** the problem
|
|
- **Acquire** the right data
|
|
- **Parse** the data
|
|
- **Mine** our data
|
|
- **Refine** our data
|
|
- **Build** a model
|
|
- **Present** our work
|
|
|
|
---
|
|
|
|
## Discussion: What-for-what?
|
|
|
|
Match up these libraries:
|
|
|
|
- **Pandas:** for reading in data, exploratory data analysis, munging, wrangling, and visualization via matplotlib
|
|
- **Seaborn:** creates visualizations (of greater complexity) with a few lines of code via matplotlib
|
|
- **Requests:** for making web requests
|
|
- **NumPy:** for numerical computation, particularly linear algebra
|
|
- **SciPy:** for scientific computation, especially statistics
|
|
|
|
---
|
|
|
|
## Learning More - How?
|
|
|
|
- Learn by doing.
|
|
- Learning requires consuming and producing. (Perhaps even in 50/50 balance)
|
|
|
|
- Consume relevant content about what you want to learn (videos, books, etc).
|
|
|
|
- Have frequent **projects** and **exercises** to practice.
|
|
|
|
---
|
|
|
|
## Learning More - Where?
|
|
|
|
There's an abundance of resources, which can seem overwhelming, but it's actually a huge benefit.
|
|
|
|
For self-paced and online programs about a specific area, consider:
|
|
|
|
- DataCamp
|
|
- DataQuest
|
|
- Coursera
|
|
|
|
For instructor-led and guided education, come on back to General Assembly!
|
|
|
|
- We have expert-led workshops and courses in data science:
|
|
- A 10-week part-time data science (60hrs).
|
|
- The Data Science Immersive, a full-time, three month program (480hrs).
|
|
|
|
These classes walk through the full data science lifecycle.
|
|
|
|
---
|
|
|
|
## Stretchhhh
|
|
|
|

|
|
|
|
- Stand up, stretch a bit.
|
|
|
|
- Or lie down!
|
|
|
|
- I'm not a cop.
|
|
|
|
---
|
|
|
|
## What Do You Really Need?
|
|
|
|
Data scientists need three core skills:
|
|
|
|
- **Analytical thinking**
|
|
- **Mathematics and statistics proficiency**
|
|
- **Coding ability**
|
|
|
|
Let's break these down.
|
|
|
|
---
|
|
|
|
## Analytical thinking
|
|
|
|
- How well can you structure a data science problem / target an analysis for high impact output?
|
|
|
|
- Do you select metrics that align with those goals?
|
|
|
|
- Do you break a big problem into manageable, component parts?
|
|
|
|
**Class Question:**
|
|
|
|
- Imagine you are a data scientist at Facebook.
|
|
- Users list high schools they attended - some real, some fake.
|
|
|
|
How could you verify that a given high school a user listed is the one they attended? How would you measure success?
|
|
|
|
---
|
|
|
|
## Mathematics and statistics proficiency
|
|
|
|
Can you apply fundamental maths and stats to problem solving? Do you have a firm understanding of probability? Linear algebra?
|
|
|
|
**Class Question:**
|
|
|
|
- There are 52 cards in a deck.
|
|
- 26 are red, and 26 are black. The 52 cards make up four suits (hearts, diamonds, spades, clubs).
|
|
- There are 13 of each suit (ace-10, jack, queen, king).
|
|
- It is a fair deck of cards.
|
|
|
|
What is the probability of drawing the 4 of spades OR a club? What is the probability of drawing any 3 OR a spade?
|
|
|
|
---
|
|
|
|
## Coding ability
|
|
|
|
- Can you write readable, maintainable, efficient code?
|
|
- Can you translate your thinking skills into programmatic thinking?
|
|
- Do you know Python, R, SQL, and/or Scala? *(Yes, you do!)*
|
|
|
|
**Question:**
|
|
|
|
Do you recall Fizzbuzz? Try writing it again here from scratch.
|
|
|
|
Open a new Python file, `fizz.py`.
|
|
|
|
- Write a program that prints the numbers from 1 to `n` (passed in).
|
|
- But, for multiples of three, print “Fizz” instead of the number.
|
|
- For multiples of five, print “Buzz”.
|
|
- For numbers which are multiples of both three and five, print “FizzBuzz”.
|
|
|
|
|
|
---
|
|
|
|
## Establishing Yourself as a Data Scientist
|
|
|
|
1. Start a blog.
|
|
- Blogs are incredibly common in technology.
|
|
- They demonstrate your learning process.
|
|
|
|
2. Share with your network.
|
|
- Keep your friends and coworkers engaged on what you're doing and learning.
|
|
- Opportunities are sometimes spurious.
|
|
|
|
3. Attend Meetups and other networking opportunities to learn, meet, and share.
|
|
|
|
----
|
|
|
|
## Summary:
|
|
|
|
- There are many paths you can go!
|
|
- Check the Additional Reading for links to libraries.
|
|
- You probably want Seaborn, NumPy, or SciPy.
|
|
- Work on your core skills!
|
|
- Analytical thinking.
|
|
- Mathematics and statistics proficiency.
|
|
- Coding ability.
|
|
|
|
---
|
|
|
|
## Additional Reading
|
|
|
|
- [Pandas docs](https://pandas.pydata.org/pandas-docs/stable/#)
|
|
- [Seaborn docs](https://seaborn.pydata.org/)
|
|
- [Requests docs](http://docs.python-requests.org/en/master/)
|
|
- [NumPy tutorial](https://docs.scipy.org/doc/numpy-1.13.0/user/index.html)
|
|
- [SciPy tutorial](https://docs.scipy.org/doc/scipy/reference/tutorial/index.html)
|